The argument over what artificial intelligence will do to jobs has produced more confusion than clarity. The debate is mostly based on predictions from assumptions, often based on unexamined and mostly biased prior beliefs. Depending on what you watch or who you follow you will likely get a different set of data points and historical parallels to affirm your current beliefs. There are Economists who show how technology diffusion is slow like how slowly electricity and computers changed the economy and productivity curves. There are AI labs who publish benchmarks showing their models handling ever longer and harder tasks. Then there are statistical agencies that survey how many companies have actually put the technology to use, and political theorists who ask who will pocket the gains if the machines prove as capable as their makers claim.
Each of these data sets is useful, but read in isolation each tends to confirm whatever its owner already believed. This article proposes no new theory of technological change, but aims to take the most reliable measure from each camp, and connect them into a single chain that a reader can use to understand the challenges AI presents economically and politically and also to monitor which of the many scenarios is likely to take hold over time to be better prepared.
Instead of forecasting what exactly will happen, we should approach this as a scenario planning exercise. A forecast starts from an assumption about how the world works and projects it forward, which is why forecasts about AI and jobs so often read as verdicts: if one assumes that capability translates directly into lost jobs, or that this technology will behave like every one before it, the conclusion follows almost automatically. Scenario planning takes a different approach. Rather than predicting a single future, it examines several plausible ones, each built on clearly stated assumptions, and then names in advance the signals that would show which of them is taking shape
The Four Scenarios
First, it is best to separate the questions of how AI will impact jobs into two dimensions. The first is whether the technology can do the work, which depends both on how much of the economy’s work falls within its reach (breadth) and on how much of that work it can finish unaided to an acceptable standard (depth). The second is how fast do businesses adopt this new technology and reorganize around it. The two dimensions move at different speeds and show up in different data, and combining them produces a matrix of four scenarios.
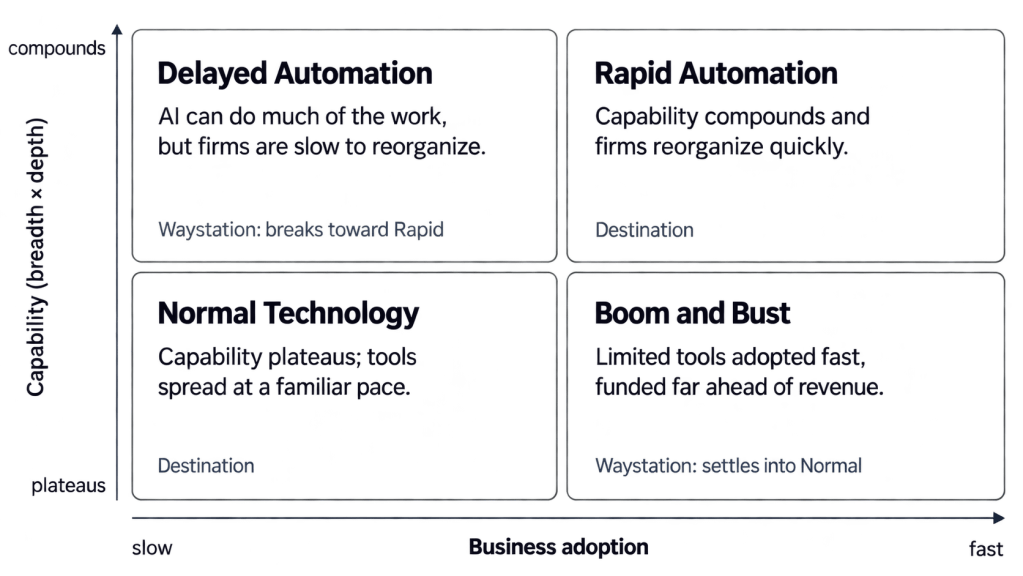
In Rapid Automation, capability keeps compounding and businesses adopt quickly to use it, so the economy absorbs years of change in a short span. Disruption impacts most office occupations at once as technology capabilities advance in both breadth and depth of tasks that could be automated.
In Delayed Automation, capability compounds but adoption lags, because businesses need time to change processes, retrain staff and ensure proper governance, much as factories took decades to reorganize around the electric motor. This scenario will eventually give way to Rapid Automation once firms catch up.
In Normal Technology, a term borrowed from Arvind Narayanan and Sayash Kapoor, capability levels off and the tools spread at a familiar pace, reshaping occupations gradually in the way personal computers did. Disruption is broad but shallow, affecting many jobs a little as technology depth lags thus not eliminating jobs outright giving workers time to adjust over longer time.
In Boom and Bust, firms rush to adopt tools that prove less capable than promised, financed by investment that runs far ahead of revenue. When the correction comes, the economy settles into something closer to Normal Technology, but after considerable financial damage.
Impact on the Labor Market
Each scenario implies a different pattern of impact on jobs and the labor market at large. These patterns are informed by research from Stanford’s Digital Economy Lab, MIT and the National Bureau of Economic Research, and by the work of economists such as Daron Acemoglu, Pascual Restrepo, David Autor and Erik Brynjolfsson on how earlier technologies and now AI reshape the labor market.
| Scenario | Likely pattern in the labor market |
| Rapid Automation | Displacement outruns the creation of new work, spreading from entry-level roles to mid-career professionals within a few years |
| Delayed Automation | Firms stop hiring juniors in exposed occupations long before they lay anyone off, so unemployment stays low while career ladders quietly narrow |
| Normal Technology | Work is reallocated gradually, as in the PC era, with some occupations shrinking, others growing and wages adjusting over a decade or more |
| Boom and Bust | Hiring swings with the investment cycle, and layoffs follow when spending on AI is cut |
Whether work disappears faster than it is created is therefore the hinge of the whole framework. Daron Acemoglu and Pascual Restrepo describe the labor market as a race between automation, which displaces workers from tasks, and reinstatement, which creates new tasks for them, and the balance of that race determines how much of the economic shock lands on workers. This is the bridge, because it connects what happens to work with what happens next in politics. A steep loss of jobs among software engineers and a modest one across most office work could add up to similar totals, but the second reaches far more households, communities and voters, and its political cost is correspondingly higher.
Economic and Political Implications
Impacts on labor markets do not stay isolated. When jobs disappear faster than new ones are created, the consequences show up on household incomes and consumer demand, tax policies and public budgets, and election outcomes locally and nationally. The previous section examined how large the shock will be, but politics determines who benefits and who pays the price. Two questions become critical to answer. The first is how widely the gains spread: whether they stay with the owners of models, chips and data centers and the few regions that host them, or reach most households through wages, lower prices, taxes and public stakes. The second is whether the response to displacement matches it in both reach and timing, so that support arrives before displacement spreads and covers as many workers as the disruption does, since a program designed for a single industry is no answer to a shock that runs across the whole economy, however early it is enacted.
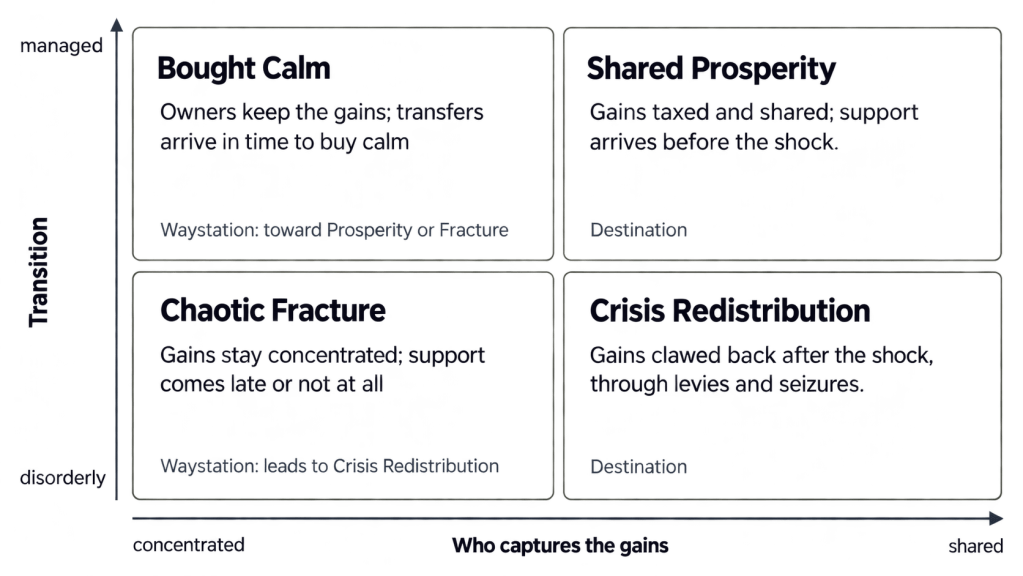
| Outcome | Wealth | Growth | Stability |
| Shared Prosperity | Gains spread through taxes, dividends and public stakes | High and durable | Stable |
| Bought Calm | Owners keep the gains; transfers buy calm | High on paper, weak demand | Calm surface, eroding legitimacy |
| Crisis Redistribution | Clawed back after a shock | Hit by capital flight | Volatile, then resets |
| Chaotic Fracture | Extreme concentration, then forced reversal | Boom, then bust | Unstable |
The most dangerous combination is wide disruption paired with narrow gains and narrow support, because it touches the largest number of voters while offering the fewest of them a stake in the new economy. The China trade shock offers a warning: the main federal response, Trade Adjustment Assistance, reached relatively few of the workers affected, and the regions it hit became markedly more polarized, as Autor and colleagues later documented. Which of these outcomes a country reaches depends less on the technology than on its political system, and in particular on whether it can impose a loss on concentrated winners before a shock forces it to. Even the mildest scenario for work can strain a democracy if its gains accrue to a few while its costs are spread across many.
AI to Societal Impact Chain
With the scenarios and their consequences laid out, the full chain can be assembled. The relationship and flow could be described as answers to the following four questions
- Can AI do the work? Capability is measured along two dimensions: breadth, meaning how much of the economy’s work falls within the reach of current models, and depth, meaning how much of that work a model can finish on its own to the standard a paying client would accept.
- How fast are businesses adopting it? Adoption is read the same way, by asking how many firms use the technology, how heavily they spend on it once they do, and whether the investment behind it is likely to pay for itself.
- Is work disappearing faster than it is being created? This is the bridge between the economic and political halves of the framework, the place where the contest between displacement and reinstatement that Acemoglu and Restrepo describe first shows up in employment data.
- Who captures the gains, and how soon does help arrive? With any large economic changes, there are winners and losers. How it will play out will depend on what governments actually enact based on the pressures different groups will put and the powers they hold.
The bridge deserves the closest attention, because changes in hiring tend to signal which political outcome is approaching well before the political system registers it.
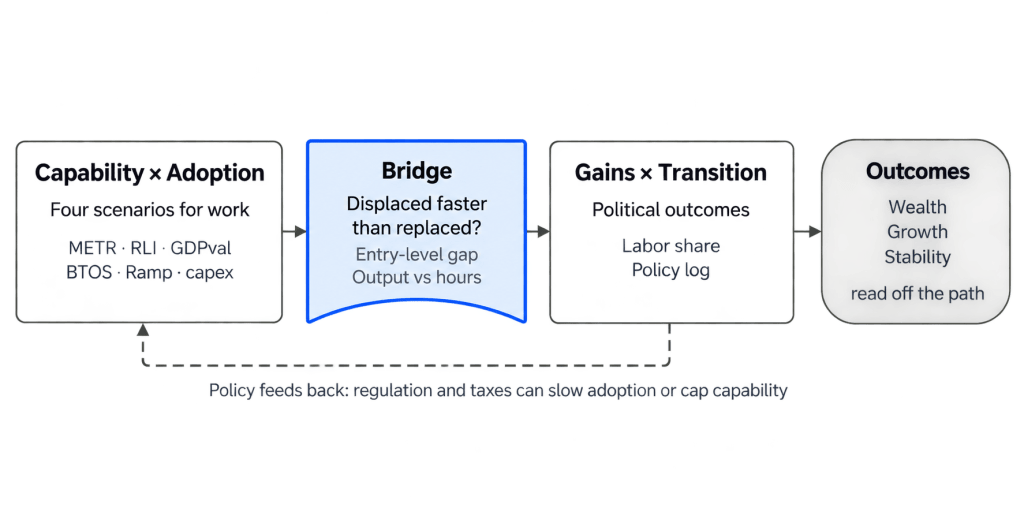
In this chain the first grid determines how large the economic shock will be, the bridge measures how much of it falls on workers, and the second grid determines who ends up bearing the cost.
Ten Indicators to Watch
To assess where we are in this chain and to track which direction we are heading, we need to identify key indicators to monitor per key dimension from the scenarios and questions discussed before. Ten indicators are proposed:
| Question | Indicator | What it shows | Latest reading |
| Capability: depth | Task horizon (METR) | Length of task AI finishes on its own | Over 16 hours at 50% reliability (May 2026) |
| Capability: depth | Remote Labor Index (Scale AI, Center for AI Safety) | Share of real freelance projects delivered to a client’s standard | 15.8% (Jul 2026), from 2.5% (Oct 2025) |
| Capability: breadth | GDPval (OpenAI) | Expert-graded AI work across 44 occupations in the 9 largest US industries | Near parity, 49.7% (Dec 2025) |
| Adoption: breadth | Business Trends and Outlook Survey (Census Bureau) | Share of firms using AI | 17–20% of firms; 32–37% of firms with 100+ staff (May 2026) |
| Adoption: depth | Ramp AI Index (Ramp) | What businesses actually pay for AI | Top firms cut spend per employee 9.7% (Aug 2026) |
| Adoption: durability | Capex vs AI revenue (company filings) | Whether the build-out can pay for itself | About $650–700B capex guided for 2026; gap about $600B a year |
| Bridge: leading | Entry-level employment gap (Brynjolfsson, Chandar and Chen, Stanford) | Jobs for ages 22–25 in AI-exposed work, against trend | 19% below trend (Jun 2026) |
| Bridge: lagging | Productivity vs hours (BLS) | Output growing without added work | Productivity +2.2%, hours +0.2% (year to Q2 2026) |
| Gains | Labor share (BLS) | Labor’s slice of national income | 52.8%, a record low (Q2 2026) |
| Transition | Policy action log (kept here) | Measures enacted, timed against the bridge | No transition measure enacted |
The distinction between breadth and depth runs through both capability and adoption, with one indicator in each pair showing how widely the change has spread and the other showing how far it has gone. It matters because a technology can be present in almost every office while doing little in any of them, or transform a handful of trades while leaving the rest of the economy untouched, and only the combination of the two is likely to reprice work on a large scale.
Where to go from here
So, will AI take my job? None of these indicators settles the question on its own, and read individually each can be made to support almost any story. Read together, they should be held to a few simple disciplines. The leading indicators, chiefly the capability measures and the entry-level employment gap, are allowed to move the overall assessment, while lagging ones such as productivity and labor’s share of income only confirm it. The direction of a series matters more than its level, and no assessment should change on the strength of a single quarter, since a signal that does not persist is more likely to be noise from the latest hype cycle than evidence of a durable shift. Applied to today’s data, the indicators point most clearly to Delayed Automation. Expert graders already rate AI’s work on individual tasks as roughly equal to that of professionals across dozens of occupations, yet the best models complete only about one real freelance project in six to a client’s standard, and businesses are adopting the technology at roughly the pace they once adopted personal computers. Breadth has run well ahead of depth, which is why the labor market still looks calm everywhere except among the youngest workers in the most exposed occupations. If depth catches up with breadth, that calm is unlikely to last, and the adjustment could arrive faster than headline employment figures would suggest.
The political picture is less settled but hardly reassuring. The gains so far have gone mainly to the owners of capital, with labor’s share of national income at a record low, and no measure for displaced workers has been enacted. This is where watching the bridge pays off, because it gives warning: if displacement begins to spread across occupations and regions before support is in place, the country drifts toward the lower half of the second grid, and the window for a managed transition narrows.
The question in the title has no single answer, because it depends on choices that businesses, governments and workers have yet to make. What can be known is which of these futures the evidence is pointing toward, and how much time remains to prepare. The framework laid here should help in making better decisions about careers, savings and the policies worth supporting.
Sources
- AI as Normal Technology — Narayanan and Kapoor
- Levels of AGI for Operationalizing Progress on the Path to AGI — Morris and colleagues, Google DeepMind
- Automation and New Tasks — Acemoglu and Restrepo
- The Productivity J-Curve — Brynjolfsson, Rock and Syverson
- Four Futures for Jobs in the New Economy — World Economic Forum
- The Art of the Possible: Peter Frase’s Four Futures — Los Angeles Review of Books
- Economic Scenarios for Transformative AI — Korinek and colleagues
- Task-Completion Time Horizons — METR
- A Significant Increase in Digital Labor Automation — Center for AI Safety
- GDPval — OpenAI
- Large Firms Biggest AI Users — US Census Bureau
- Ramp AI Index, September 2026 — Ramp
- The AI capex-to-revenue gap is widening — Forbes
- The AI employment gap for young workers has widened to 19% — Stanford Digital Economy Lab
- Productivity and Costs and Labor share at its lowest level — BLS
- The Polarization of Job Opportunities in the U.S. Labor Market — Autor
- New Frontiers: The Origins and Content of New Work, 1940–2018 — Autor, Chin, Salomons and Seegmiller
- Scenarios for the Transition to AGI — Korinek and Suh
- The Great Compression: The Wage Structure in the United States at Mid-Century — Goldin and Margo
- Power and Progress — Acemoglu and Johnson
- Engels’ Pause: Technical Change, Capital Accumulation, and Inequality in the British Industrial Revolution — Allen
- Capital in the Twenty-First Century — Piketty
- End Times: Elites, Counter-Elites, and the Path of Political Disintegration — Turchin
- Going to Extremes: Politics after Financial Crises, 1870–2014 — Funke, Schularick and Trebesch
- Importing Political Polarization? The Electoral Consequences of Rising Trade Exposure — Autor, Dorn, Hanson and Majlesi
- The Great Leveler: Violence and the History of Inequality — Scheidel


Leave a comment